For the last couple of months, multiple fields within the Southwest of the Netherlands were tracked with use of the Barley Yellow Dwarf Virus (BYDV) decision support system. The BYDV DSS makes use of weather data of a specific selected region. Out of this data, the system gives an indication of the risk of winged aphids within the field. After the day of crop emergence is filled into the system, the model starts to sum up the temperature. Every degree above the base temperature of 3 degrees Celsius is added to the T-Sum. This means that especially with higher temperatures after crop emergence, the T-Sum of 170 degree days is reached quicker and actions should be taken.
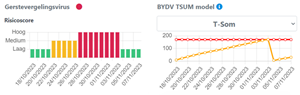
Within the figure above, the T-Som is given for a field of winter wheat which emerged on the 18th of October. From this date, the model started counting the degree days and the risk for BYDV increased. Pictures were taken at different time intervals and at 103 degree days (27th of October) the first aphids were discovered within the field. At this time, there was a high risk of BYDV in the field (red bars within the graph). From the picture below, it can be seen that the first aphids were seen during the field observation (picture 1).
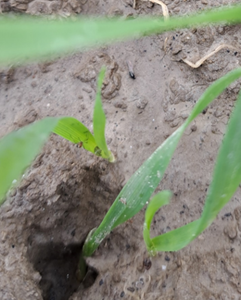
Picture 1: Aphids in the field.
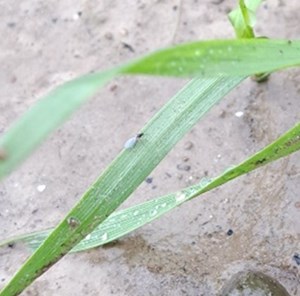
Picture 2: Young Aphid on the crop in October
For another field with an emergence date of the 16th of October, a picture was taken at 150 degree days. During this time, young aphids were already visible on the stem as can be seen on the picture nr 2. In spring, crop monitoring will be done again in order to see how the aphids evolved and if the winter weather resulted in less aphids on the crops.
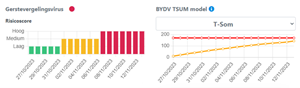
The figure above is of a field which emerged on the 27th of October. What is seen is that the T-Sum of 170 is reached slower, compared to previous fields. This is the result of the weather conditions. Sowing at the end of October already can result in a lower risk of the emergence of winged aphids, compared to sowing in the beginning of October. Especially when weather conditions are favourable for the aphids (warm temperatures during autumn and winter) the sowing date can make a big difference.